The random walk challenge
Posted on March 15, 2019 at 12:00 PM
In previous tutorials, we have looked at NumPy, Pandas and Maplotlib - in this tutorial we look at combining all these packages to solve the "random walk" challenge.
- The random walk challenge
- Installs
- Flipping the coin
- Playing the game repeatedly
- Plotting the distribution
- Code takeaway
The random walk challenge
Imagine you have a coin and an infinite staircase in front of you. If you throw a heads, you take two steps up - conversely, if you throw a tails you take one step down. Lastly, you're a bit clumsy so there’s a 7% chance you drop the coin and in that case you must go down 5 steps. You can never go below the bottom step. On what step would you be after 1000 coin tosses?
There are two ways to solve this problem - you could solve mathematically with probability, or alternatively you can simulate the games. In this example, we are going to simulate the game many times over to get a distribution of results which we can plot.
Installs
The three packages we be will using are Pandas, NumPy and Matplotlib which do not come preinstalled with Python. These can be installed using pip.
pip install pandas
pip install NumPy
pip install matplotlib
For all the preceding code, you will need to import the respective packages below. You can import with or without conventions although its typically recommended you use conventions so others can understand your code.
>>> import NumPy as np
>>> import pandas as pd
>>>import matplotlib.pyplot as plt
Simulating the coin toss and traveling up the stairs
The first thing I have done is set the seed - this means the random numbers are predictable so everyone will get the same results. Then the random walk is initialised as a list, with the first step being zero. We now define how many times we will toss the coin, and use a for loop to simulate the flipping of the coin. Using np.random.randint() we return either 0 or 1 representing heads of tails with equal probability. Finally, we take the previous step and add to the current step (depending upon the result of the coin) and append to the list and plot the list (which represents travelling up the stairs).
>>> np.random.seed(123)
>>> random_walk = [0]
>>> coin_tosses = 1000
>>> for flip in range(coin_tosses):
    coin = np.random.randint(0,2)
    step = random_walk[flip]
    if coin == 1:
        step = step + 2
    else:
        step = max(0, step - 1) # this stops the step from going below 0 on the bottom step

    random_walk.append(step)


>>> plt.plot(random_walk)
>>> plt.show()
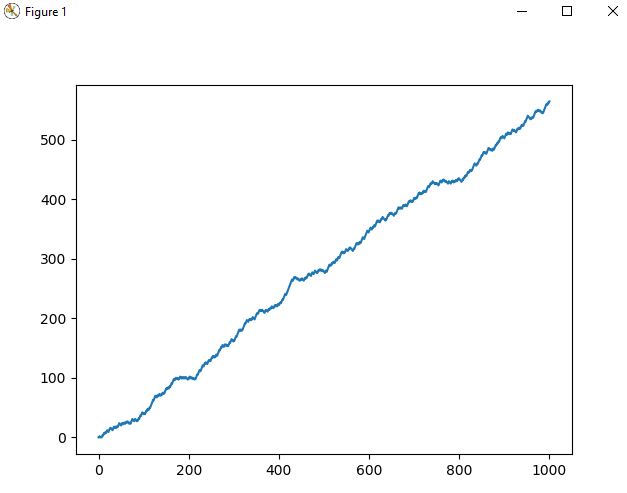
The graph below shows the results of 1000 coin tosses and progress up the stairs. Its fairly predictable that 1000 coin tosses gets you close to 500 steps.
Play the game 10 times
Following on from the previous code block, we create a range of games, loop through each game and create a list which contains the results of each unique random walk. We then convert this into a NumPy array, transpose the data (otherwise the graph is hard to interpret) and plot and show the graph.
>>> coin_tosses = 1000
>>> no_of_games = 10
>>> all_walks = []
>>> for game in range(no_of_games):
    # create a list for steps
    random_walk = [0]
    for flip in range(coin_tosses):
        coin = np.random.randint(0,2)
        step = random_walk[flip]
        if coin == 1:
            step = step + 2
        else:
            step = max(0, step - 1) # this stops the step from going below

        random_walk.append(step)
    all_walks.append(random_walk)

>>> np_walks = np.array(all_walks)
>>> np_walks_transpose = np.transpose(np_walks)
>>> plt.plot(np_walks_transpose)
>>> plt.show()
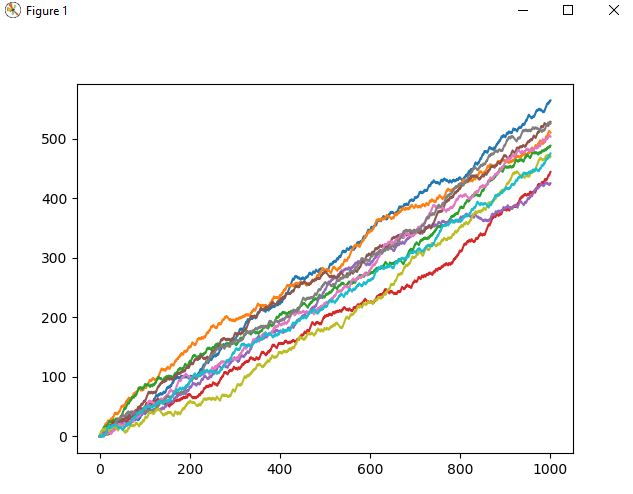
The graph below shows the results of 10 games, each line being a unique game. Now you can see we have a bit of a distribution of results, with some players closer to 400 and others closer to 600.
Factoring clumsiness
Remember, we stated in the game that there is a 7% chance of dropping the coin which means we must go down five steps - we will now factor this in. We simply generate another number between 0-1 and if the number is less than or equal to 7% (0.07) then we take 5 steps down.
>>> coin_tosses = 1000
>>> no_of_games = 10
>>> all_walks = []
>>> for game in range(no_of_games):
    # create a list for steps
    random_walk = [0]
    for flip in range(coin_tosses):
        coin = np.random.randint(0,2)
        step = random_walk[flip]
        if coin == 1:
            step = step + 2
        else:
            step = max(0, step - 1) # this stops the step from going below

        if np.random.rand() <= 0.07:
            step = max(0, step - 5)
        random_walk.append(step)
    all_walks.append(random_walk)


>>> np_walks = np.array(all_walks)
>>> np_walks_transpose = np.transpose(np_walks)
>>> plt.plot(np_walks_transpose)
>>> plt.show()
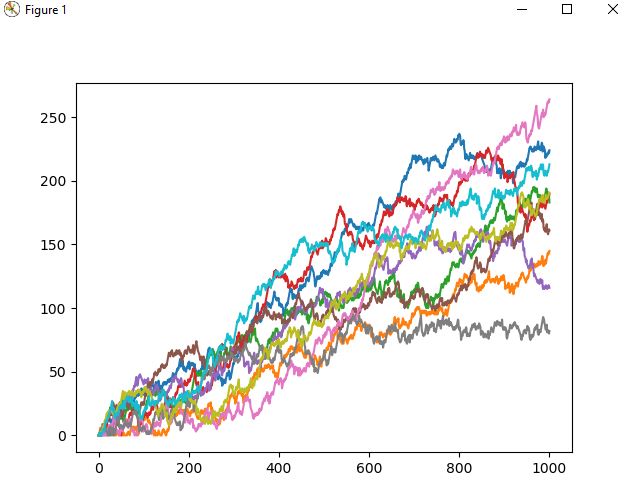
The graph below shows 10 games factoring clumsiness. Note how the distribution is getting larger.
Plotting the distribution
Following on from the previous code - now we have results of 10 games. If we take the final result of each game, we can see what step every player ended up on after 1000 coin tosses. For this final example, we are going to up the simulation to 10,000 players. Note, this can take a bit longer to run especially on old machines. To get the final result of each game we simply slice the NumPy array and plot onto a histogram.
>>> coin_tosses = 1000
>>> no_of_games = 10000
>>> all_walks = []
>>> for game in range(no_of_games):
    # create a list for steps
    random_walk = [0]
    for flip in range(coin_tosses):
        coin = np.random.randint(0,2)
        step = random_walk[flip]
        if coin == 1:
            step = step + 2
        else:
            step = max(0, step - 1) # this stops the step from going below

        if np.random.rand() <= 0.07:
            step = max(0, step - 5)
        random_walk.append(step)
    all_walks.append(random_walk)


>>> np_walks = np.array(all_walks)
>>> np_walks_transpose = np.transpose(np_walks)
>>> ends = np_walks_transpose[-1]
>>> plt.plot(ends)
>>> plt.show()
The histogram below shows the distribution of 10,000 players final step (or step height) after 1000 coin tosses using the rules stated.
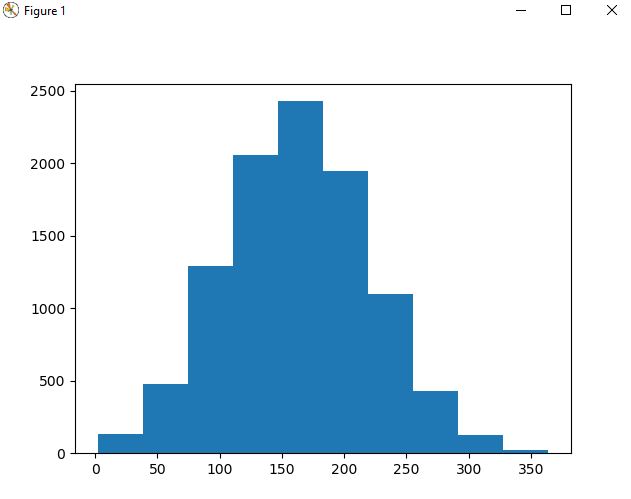
Don't forget using NumPy you can look at simply statistics, like the mean, mode standard deviation etc by calling their respective methods.
>>> ends.max()
218
>>> ends.min()
50
>>> ends.mean()
158.5
>>> ends.std()
44.815733844265004
Code takeaway
This code can be added to a python file (.py) and run in the terminal.
import NumPy as np
import pandas as pd
import matplotlib.pyplot as plt
np.random.seed(123) # this means we get the same results everytime

# number of coin tosses
coin_tosses = 1000
no_of_games = 10000

all_walks = []
for game in range(no_of_games):
    # create a list for steps
    random_walk = [0]
    for flip in range(coin_tosses):
        coin = np.random.randint(0,2)
        step = random_walk[flip]
        if coin == 1:
            step = step + 2
        else:
            step = max(0, step - 1) # this stops the step from going below

        if np.random.rand() <= 0.07:
            step = max(0, step - 5)

        random_walk.append(step)
    all_walks.append(random_walk)

np_walks = np.array(all_walks)
np_walks_transpose = np.transpose(np_walks)
ends = np_walks_transpose[-1]

plt.hist(ends)
plt.show()