Importing data for data science with Python
Posted on April 11, 2019 at 12:00 PM
Data can come from a number of sources and formats - text files, CSV, Excel, SAS, Matlab, relational databases, scrapped from the web... the list goes on! In this tutorial we'll look at the basics for importing files with the NumPy and Pandas packages.
- Installs
- Reading a text file
- Reading a CSV in NumPy
- Reading a CSV in Pandas
- Reading an Excel file in Pandas
Installs
The three packages we be will using are Pandas,NumPy and Matplotlib which do not come preinstalled with Python. These can be installed using pip.
pip install pandas
pip install numPy
pip install matplotlib
Reading a text file
To read a text file in Python you simply pass the file path to the built in function 'open' with the 'r' parameter which stands for r (you can also use 'w' or 'a' to write or append to a file respectively) and store as a variable. You can then iterate through the file or read in a one go - note for larger files its wise to iterate through. Once you are finished with your file, you must close the file.
>>> file = open('made_up_text.txt', 'r')
>>> file.read()
'the cat ran across the road\nthe dog ran across the road after the cat\n'
>>> file.close()
To iterate through the file, you simply use a for loop.
>>> file = open('made_up_text.txt', 'r')
>>> for line in file:
	print(line)


the cat ran across the road
the dog ran across the road after the cat

>>> file.close()
Lastly, you'll see many instances of code which opens a file, does something with the contents and immediately closes once complete.
>>> with open('made_up_text.txt', 'r') as file:
	print(file.read())


the cat ran across the road
the dog ran across the road after the cat
Reading a CSV into NumPy
To read a CSV file with NumPy you can use the NumPy function 'loadtxt()'. You pass the file name into the parameter - on this occasion we have also passed the 'skiprows' parameter as the opening row is a column header which is a string.
>>> file = np.loadtxt('made_up_numbers.csv',skiprows=1)
>>> file
array([  1.,  43.,  63.,  18.,  32.,  34.,  65.,  21.,  36.,  22.,  63.,
        62.,  91.,  82.,  23.,  30.,  70.,  24.,  93.,  15.,  28.,  71.,
        22.,   7.,  46.,  21.,  87.,  99.,  35.,   8.,  69.,  15.,  36.,
        37.,  39.,  96.,  42.,  66.,  52.,  57.,  84.,  44.,  21.,  89.,
        77.,  22.,  96.,  38.,  44.,  12.,  35.,  42.,  12.,  74.,  31.,
         3.,  60.,  48.,  73.,  72.,  10.,  77.,  30.,  91.,  60.,  15.,
        25.,  34.,  64.,  52.,  81.,  78.,  74.,   9.,  44.,  74.,  88.,
        90.,  71.,  68.,  44.,  43.,  83., 100.,  92.,  64.,  84.,  58.,
         5.,  13.,  59.,  13.,  28.,  43.,  89.,  12.,  67.,  97.,  37.])
>>> file.sum(file)
>>> np.sum(file)
4964.0
The CSV above only has one column, but you can also pass in CSV files with multiple columns. In the example below, you must pass how the file is delimited (CSV, standing for 'comma-separated values', is delimited by commas) - this is often by a comma, but can be a tab or another symbol.
>>> file = np.loadtxt('made_up_numbers2.csv', delimiter=',', skiprows=1)
>>> file.shape
(99, 2)
Reading a CSV into Pandas
Similarly to importing data in NumPy, Pandas has a similar function to read CSVs - 'read_csv'. In the example below I have taken a download of data from Kaggle about Fifa19's footballer players and respective KPI's.
>>> df = pd.read_csv('data.csv')
>>> df.head()
   Unnamed: 0      ID       ...       GKReflexes  Release Clause
0           0  158023       ...                8         €226.5M
1           1   20801       ...               11         €127.1M
2           2  190871       ...               11         €228.1M
3           3  193080       ...               94         €138.6M
4           4  192985       ...               13         €196.4M

[5 rows x 89 columns]
>>> df.columns
Index(['Unnamed: 0', 'ID', 'Name', 'Age', 'Photo', 'Nationality', 'Flag',
       'Overall', 'Potential', 'Club', 'Club Logo', 'Value', 'Wage', 'Special',
       'Preferred Foot', 'International Reputation', 'Weak Foot',
       'Skill Moves', 'Work Rate', 'Body Type', 'Real Face', 'Position',
       'Jersey Number', 'Joined', 'Loaned From', 'Contract Valid Until',
       'Height', 'Weight', 'LS', 'ST', 'RS', 'LW', 'LF', 'CF', 'RF', 'RW',
       'LAM', 'CAM', 'RAM', 'LM', 'LCM', 'CM', 'RCM', 'RM', 'LWB', 'LDM',
       'CDM', 'RDM', 'RWB', 'LB', 'LCB', 'CB', 'RCB', 'RB', 'Crossing',
       'Finishing', 'HeadingAccuracy', 'ShortPassing', 'Volleys', 'Dribbling',
       'Curve', 'FKAccuracy', 'LongPassing', 'BallControl', 'Acceleration',
       'SprintSpeed', 'Agility', 'Reactions', 'Balance', 'ShotPower',
       'Jumping', 'Stamina', 'Strength', 'LongShots', 'Aggression',
       'Interceptions', 'Positioning', 'Vision', 'Penalties', 'Composure',
       'Marking', 'StandingTackle', 'SlidingTackle', 'GKDiving', 'GKHandling',
       'GKKicking', 'GKPositioning', 'GKReflexes', 'Release Clause'],
      dtype='object')
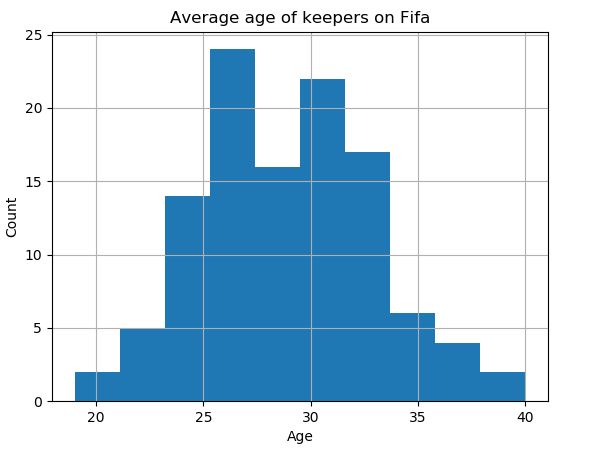
We can subsequently pass data from the Pandas DataFrame into a NumPy array to perform some basic statistical analysis. For example, we can compare the average age of goal keepers and strikers.
>>> avg_age_keeper = df[df['Position'] == 'GK'] # returns a DataFrame
>>> np.mean(avg_age_keeper['Age']) # passes a data series to NumPy
28.973214285714285

>>> avg_age_striker = df[df['Position'] == 'ST']
>>> np.mean(avg_age_striker['Age'])
28.27173913043478
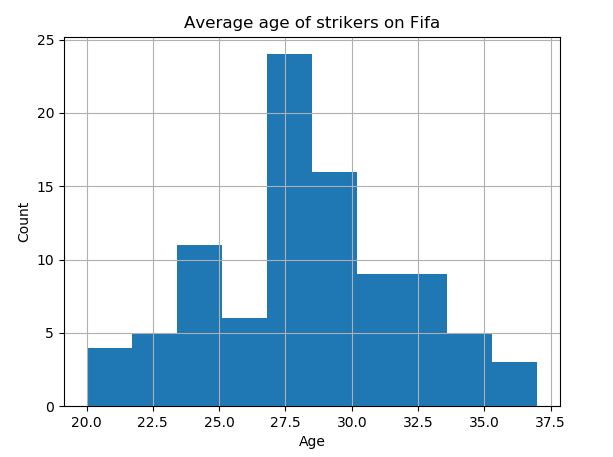
Interestingly, it appears goal keepers on average are only marginally older than strikers (on Fifa). Note the code above can be written on a single line as so:
 >>> avg_age_keeper = np.mean(df.loc[df['Position'] == 'GK','Age'])
 >>> avg_age_keeper
 28.973214285714285

>>> avg_age_striker = np.mean(df.loc[df['Position'] == 'ST','Age'])
>>> avg_age_striker
28.27173913043478
Lastly we can plot the distributions on a histogram.
# plot average age of keepers
>>> pd.DataFrame.hist(avg_age_keeper[['Age']])
>>> plt.xlabel('Age')
>>> plt.ylabel('Count')
>>> plt.title('Average age of keepers on Fifa')
>>> plt.show()

# plot average age of strikers
>>> pd.DataFrame.hist(avg_age_striker[['Age']])
>>> plt.xlabel('Age')
>>> plt.ylabel('Count')
>>> plt.title('Average age of strikers on Fifa')
>>> plt.show()
Reading an Excel file to Pandas
Reading an Excel file is very similar to a CSV - you use the pandas function 'ExcelFile()'. Subsequently you can pass which sheet you would like to read into the DataFrame. Note, you may need to install 'xlrd' via pip - 'pip install xlrd'.
>>> df = pd.ExcelFile('data.xlsx')
['data', 'another sheet']
>>> df = df.parse('data')
>>> df.head()
       ID               Name      ...        GKReflexes Release Clause
0  158023           L. Messi      ...                 8        €226.5M
1   20801  Cristiano Ronaldo      ...                11        €127.1M
2  190871          Neymar Jr      ...                11        €228.1M
3  193080             De Gea      ...                94        €138.6M
4  192985       K. De Bruyne      ...                13        €196.4M

[5 rows x 88 columns]