Categorising keywords at scale using Python,Pandas and NLTK
Posted on April 12, 2019 at 19:00 PM
Anyone that has had to keyword research before will know about the hours upon hours you spend categorising your data after you've collected it. Fortunately, there are a few nifty ways to speed up this process using natural language processing. There are many tools out there - perhaps most notably Google's natural language tool. For this tutorial we'll be looking at a Python Package known as NLTK.
- Installs
- Keyword data set
- Categorising keywords with NLTK
- Reading CSV to Pandas DataFrame
- Finding the noun, adjective and verb within keywords
- Applying functions to DataFrame
- Graphing the data
- Final thoughts
- Code takeaway
Installs
For the script we'll be using Pandas, NumPy, Matplotlib (to plot some distributions of the most common keywords for our data set), NLTK and Pickle. Below shows the command to pip install.
pip install pandas
pip install numpy
pip install matplotlib
pip install nltk
pip install pickle
As we'll be using all these packages, you should import them at the top of your Python script with the conventions provided.
import pandas as pd
import matplotlib.pyplot as plt
import nltk
from nltk.tokenize import sent_tokenize, word_tokenize
import pickle
Keyword data set
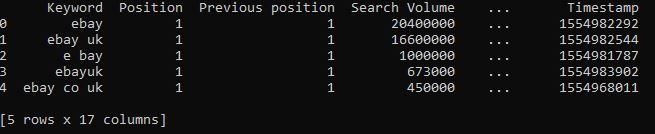
Before we can categorise our keywords we need a data set! If you've actually produced some keyword research you can use this. Alternatively, if you have access to a tool like SEMrush or Search Metrics you can pull keywords from there - for my example I have pulled 50,000 keywords from SEMrush for https://www.ebay.co.uk/. Save the file as a CSV as we'll be reading a CSV file into a Pandas DataFrame. I have taken a screenshot of the CSV keyword data set I have from SEMrush - note, you do not need all the extra columns just the 'Keyword' column containing all your keywords.

Categorising keywords with NLTK
Reading CSV to Pandas DataFrame
First thing we need to do is read the keyword data CSV into a DataFrame using the Pandas method 'read_csv()'. You can check this has worked as planned by printing a snippet of the dataframe using the Pandas method '.head()'
df = pd.read_csv('keyword_data.csv')
print(df.head())
Finding the noun, adjective and verb within keywords
Now we have a DataFrame with our keywords, we need a way to categorise them. The approach will be to write three functions to find the noun, adjective and verb from each keyword (or row from the DataFrame) and then apply these functions to the DataFrame. Firstly though we will write the functions. Each function will take a keyword, which will be 'tokenized' and then labelled. The process of 'tokenization' basically takes a string and splits it into a list of words. The labelling basically means tagging each word with its part of speech i.e. is it a noun, adjective, verb or something else?
For example in the code below, we take a simple string, tokenize it and then label the keywords. Note, you'll need to import NLTK as noted above for this to work.
>>> sentence = "the scared cat ran across the road"
>>> tokens = nltk.word_tokenize(sentence)
>>> tokens
['the', 'scared', 'cat', 'ran', 'across', 'the', 'road']
>>> tagged = nltk.pos_tag(tokens)
>>> tagged
[('the', 'DT'), ('scared', 'JJ'), ('cat', 'NN'), ('ran', 'VBD'), ('across', 'IN'), ('the', 'DT'), ('road', 'NN')]
Notice how the tagged returns a list of tuples and the labels are acronyms - 'NN' is a noun, 'VB' is a verb and 'JJ' is an adjective.
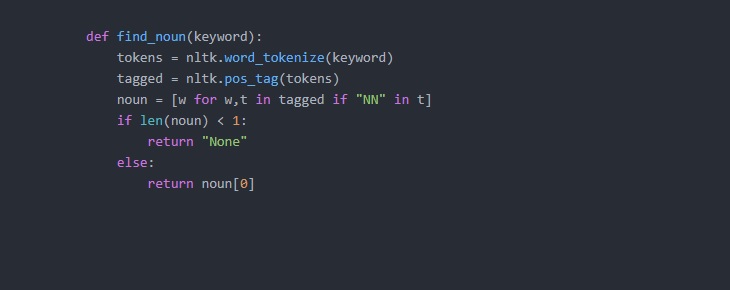
Returning to our original goal, we'll now write a function. The function will take a keyword, tokenize the keyword and label its part of speech. We're only interested in certain words to categories like the noun so we'll only keep what is relevant. To do this we'll use list comprehension and create a list only when we find a relevant part of speach. Lastly we'll return the first keyword (as we do not want to return multiple nouns/adjectives/verbs for each keyword). I have written a function to return the noun, adjective and verb.
def find_noun(keyword):
    tokens = nltk.word_tokenize(keyword)
    tagged = nltk.pos_tag(tokens)
    noun = [w for w,t in tagged if "NN" in t]
    if len(noun) < 1:
        return ""
    else:
        return noun[0]

def find_verb(keyword):
    tokens = nltk.word_tokenize(keyword)
    tagged = nltk.pos_tag(tokens)
    verb = [w for w,t in tagged if "VB" in t]
    if len(verb) < 1:
        return ""
    else:
        return verb[0]

def find_adjective(keyword):
    tokens = nltk.word_tokenize(keyword)
    tagged = nltk.pos_tag(tokens)
    adjective = [w for w,t in tagged if "JJ" in t]
    if len(adjective) < 1:
        return ""
    else:
        return adjective[0]
Applying functions to DataFrame
We now have our keyword data set stored as a Pandas DataFrame and three functions to identify the noun, adjective and verb for each keyword - we simply need to apply each function to each keyword. To do this, we create a new column (which will be the keyword categorised as either a noun, adjective or verb) and 'apply' our function to the keyword row in the Dataframe.
df['Noun'] = df['Keyword'].apply(find_noun)
df['Verb'] = df['Keyword'].apply(find_verb)
df['Adjective'] = df['Keyword'].apply(find_adjective)
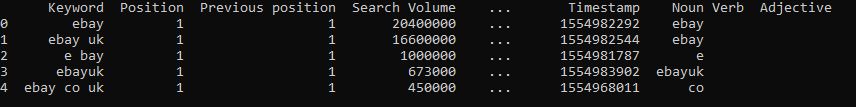
If you print the head of the DataFrame using '.head()' method you'll see the DataFrame has three new columns (for the noun, adjective and verb) and has extracted each part of speech into the column where applicable.
You can now save the DataFrame back to CSV to see the whole data set with its new categories. I also pickle the data so we can use it again for graphing.
df.to_csv('keywords_catorised.csv')
df.to_pickle('keywords_categorised_pickle')
The categorising can take a while (it took me approximately 3-4 mins to categorise 50,000 keywords) so its best to save the data once complete in the form of a pickle. In following section will take the pickle and graph some of the new categorised data.
Graphing the data using Matplotlib
As we have saved all the data up until this point, I've added a try/except clause - if the data has been saved as a pickle we use that, otherwise it will run the categorisation from scratch.
try:
    df = pd.read_pickle('keywords_categorised_pickle')

except Exception as e:
    print("Unable to load pickle, reading from file keyword_data.csv file...")
    df = pd.read_csv('keyword_data.csv')

    df['Noun'] = df['Keyword'].apply(find_noun)
    df['Verb'] = df['Keyword'].apply(find_verb)
    df['Adjective'] = df['Keyword'].apply(find_adjective)

    df.to_pickle('keywords_categorised_pickle')
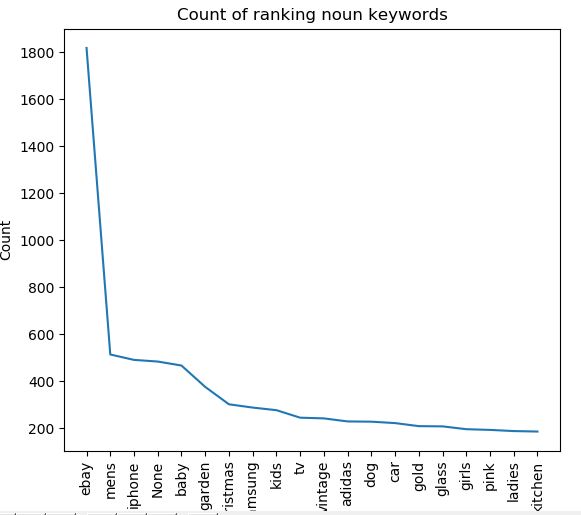
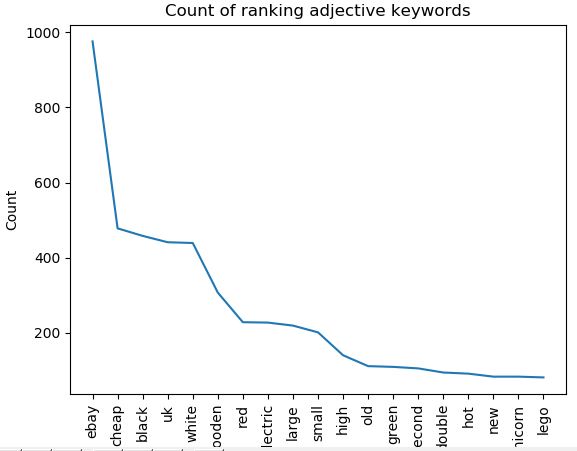
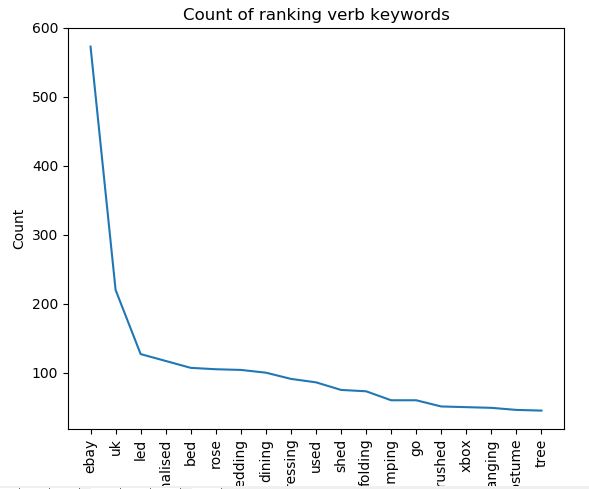
Now onto the graphing. The aim of the graph here is to give a top level view of what categories are most prominent in the data set, i.e. what is the most common noun, adjective or verb. As I have ranking data for eBay I can immediately see what keywords they rank well for which is valuable to competitors.
To graph this data, we call the 'value_counts()' method on each category columns. As there are likely thousands of different categories we take a tiny proportion by slicing - in this case I have taken the top 20 categories and store in a new variable. We then plot the data using 'plt.plot()' and pass in our variable holding the data. I have done this for the noun, adjective and verb columns.
noun = df['Noun'].value_counts()[:20]
plt.plot(noun)
plt.xlabel('Keyword')
plt.ylabel('Count')
plt.title('Count of ranking noun keywords')
plt.xticks(rotation='vertical')
plt.show()

adjective = df['Adjective'].value_counts()[1:20]
plt.plot(adjective)
plt.xlabel('Keyword')
plt.ylabel('Count')
plt.title('Count of ranking adjective keywords')
plt.xticks(rotation='vertical')
plt.show()

verb = df['Verb'].value_counts()[1:20]
plt.plot(verb)
plt.xlabel('Keyword')
plt.ylabel('Count')
plt.title('Count of ranking verb keywords')
plt.xticks(rotation='vertical')
plt.show()
Final thoughts
The aim of this post was to give an overview of how you could categorise keywords at scale. It is by no means perfect. There are lots of errors - NLTK is not perfect at finding nouns, adjectives and verbs so often it returns 'noise'. There is also the problem with words having multiple meanings and words being synonymous with one another. It can't, for example, tell you what landing pages you should build based upon the keyword data. It is a building block though, and with some tinkering if could be much improved. Where I see the value is looking at competitors rankings very quickly i.e. a competitor site like Gumtree would be interested in their rankings versus eBays to find out where there are opportunities to gain organic traffic.
Code takeaway
This code can be used in a python script and run in the command line.
import pandas as pd
import matplotlib.pyplot as plt
import nltk
from nltk.tokenize import sent_tokenize, word_tokenize
import pickle


def find_noun(keyword):
    tokens = nltk.word_tokenize(keyword)
    tagged = nltk.pos_tag(tokens)
    noun = [w for w,t in tagged if "NN" in t]
    if len(noun) < 1:
        return "None"
    else:
        return noun[0]

def find_verb(keyword):
    tokens = nltk.word_tokenize(keyword)
    tagged = nltk.pos_tag(tokens)
    verb = [w for w,t in tagged if "VB" in t]
    if len(verb) < 1:
        return ""
    else:
        return verb[0]

def find_adjective(keyword):
    tokens = nltk.word_tokenize(keyword)
    tagged = nltk.pos_tag(tokens)
    adjective = [w for w,t in tagged if "JJ" in t]
    if len(adjective) < 1:
        return ""
    else:
        return adjective[0]

saved_address = 'keywords_categorised_pickle'

try:
    df = pd.read_pickle(saved_address)

except Exception as e:
    print("Unable to load pickle, reading from file keyword_data.csv file... this could take 10mins plus")
    df = pd.read_csv('keyword_data.csv')

    df['Noun'] = df['Keyword'].apply(find_noun)
    df['Verb'] = df['Keyword'].apply(find_verb)
    df['Adjective'] = df['Keyword'].apply(find_adjective)

    df.to_pickle(saved_address)


noun = df['Noun'].value_counts()[:20]
plt.plot(noun)
plt.xlabel('Keyword')
plt.ylabel('Count')
plt.title('Count of ranking noun keywords')
plt.xticks(rotation='vertical')
plt.show()

adjective = df['Adjective'].value_counts()[1:20]
plt.plot(adjective)
plt.xlabel('Keyword')
plt.ylabel('Count')
plt.title('Count of ranking adjective keywords')
plt.xticks(rotation='vertical')
plt.show()

verb = df['Verb'].value_counts()[1:20]
plt.plot(verb)
plt.xlabel('Keyword')
plt.ylabel('Count')
plt.title('Count of ranking verb keywords')
plt.xticks(rotation='vertical')
plt.show()

df.to_csv('keywords_catorised.csv')